
Welcome to The Wheelhouse, where we discuss critical topics for marketers who want to maximise advertising effectiveness.
In this latest edition, Nic Pietersma, Group Director at Ebiquity, challenges a long-standing econometric taboo – putting spend on the right-hand side of your model. This admittedly-niche topic draws on the practical limitations of volume-based inputs in our increasingly fragmented media landscape and makes the case for a more pragmatic approach. From the shortcomings of impressions to the complexities of overfitting in digital campaigns, this piece invites marketers to reconsider what ‘best practice’ really looks like in 2025.
Picture it.
A rainy winter’s night after work, somewhere near Old Street, and a group of MMM friends gather for a pint. Of course, the evening starts with gossip. Accounts won and lost, sabbaticals, promotions, job moves. The usual.
“So, Johnnie moved to that new outfit.”
“Really? How does he like it?
“He says they’re nice. They use EViews and a bit of Python mostly. But the work isn’t great.”
“Isn’t great, how so?
“You know … dummies everywhere, tight priors. They put spend on the right-hand side.”
“Spend on the right-hand side. Crumbs!!”
An awkward silence follows, and the conversation moves on to White Lotus Season 3.
As you’ve probably gathered, The Wheelhouse this month is one for the practitioners.
Training in more straightforward times
One of the first things MMM practitioners are taught is that using adspend as an independent variable on the right-hand side of your equation is not best practice.
With spend on the right-hand side, the analyst cannot easily reward better media costs, and you cannot test different audience definitions against your data.
We are taught that the best unit of measurement is equivalent TVRs for TV, GRPs for radio, circulation for press, admissions for cinema, impressions for display, social and so on.
But times were simpler in the old days. There were fewer media lines on the plan, and they mostly had gold-standard, joint industry measurement bodies – the Audit Bureau of Circulation, RAJAR, and BARB had you covered. And that was good for roughly 80% of the media plan.
Even today, people would argue that it is still better to use rating points for TV in your model, but outside of that, spend is starting to look like a better option. The consensus is changing, the taboo is finally starting to break.
Comparing apples with apples?
Michael Kaminsky from Recast is on the right side of this topic (see his blog titled “The case against using impressions in MMM” at https://getrecast.com/cost-vs-impressions/). He argues that businesses are chiefly interested in linking investment to sales, with impressions only serving to muddy the waters. How do you control for the quality of an impression? How can you be sure impressions across different platforms are comparable? Is the definition of an impression consistent over time within one platform? These are all good points.
The FAANG five (that’s Facebook [Meta], Amazon, Apple, Netflix, and Google [Alphabet]) have historically had a different view. Their effectiveness experts tend to support using impressions or some volume measure. The challenge is that digital activity has a bewildering array of flavours. Consider YouTube. You can do 6s or 20s. Skips or non-skips. You can buy large screen or small screen only. You can buy to maximise reach, conversion, or custom audiences. The permutations multiply – but we have no reason to believe that different types of digital impressions should have comparable CPMs or deliver similar attention and sales uplift.
Now it clearly doesn’t seem right to put all those flavours of impressions into one big bucket in your statistical model. If you do that, moving to a more premium mix with a higher CPM will automatically, and often erroneously, yield a lower ROI.
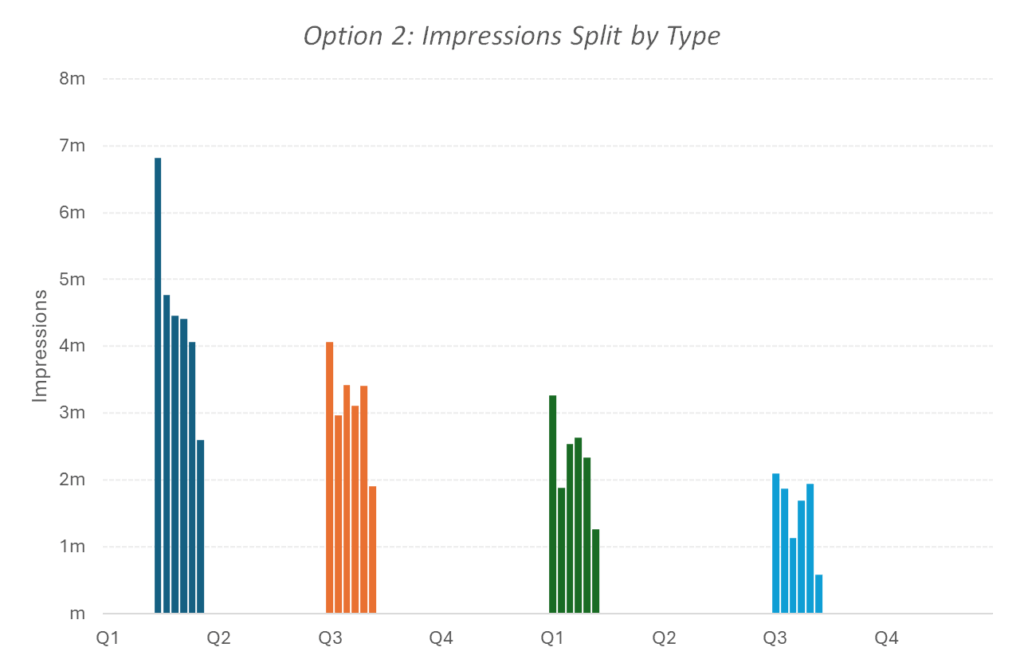
So…the usual guidance is that the analyst should split different types of impressions apart in the model and report them separately. But if we do this for every platform, we end up with wild and reckless overfitting, a phenomenon we’ve addressed previously in The Wheelhouse.
Illustrating Your Options
Consider four bursts across two years.
| Burst | Buying Strategy | Spend | CPM |
| Burst 1 | All Adults | £120k | £5 |
| Burst 2 | Adults 16-44 | £120k | £8 |
| Burst 3 | In-Market 16-44 | £120k | £12 |
| Burst 4 | In-Market 16-44. Large Screen | £120k | £18 |
Let’s look at your options. If you use impressions as your independent variable and estimate a single coefficient across all four bursts, your model will almost certainly tell you that your return on investment is getting worse over time as you buy more premium inventory, because you are getting fewer impressions for your budget.
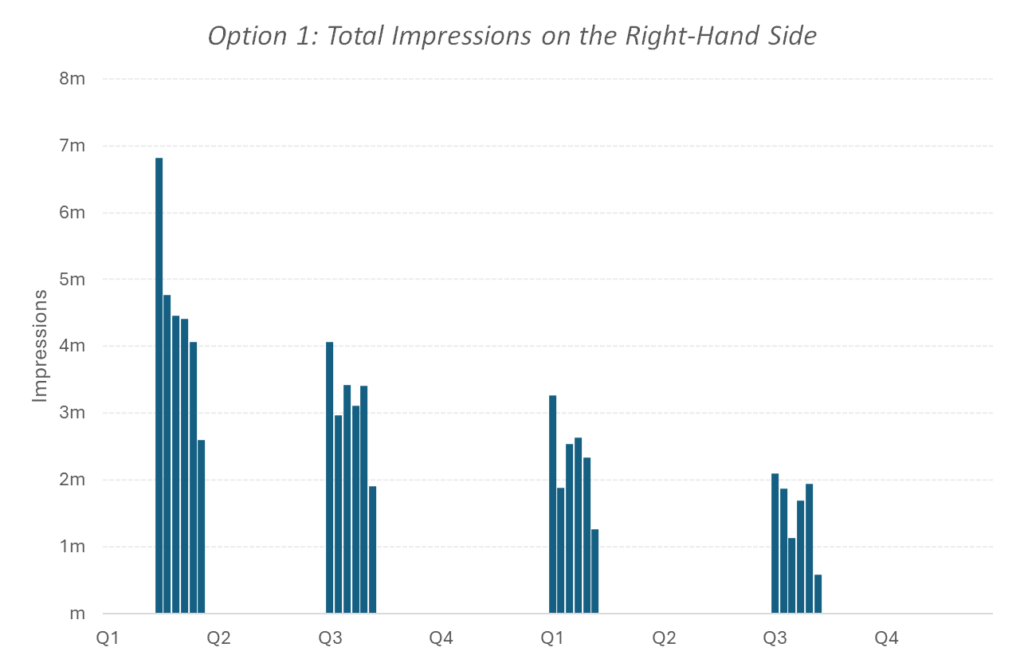
Your next option is to break it up and estimate four separate coefficients. This might be better because you might find that the more premium inventory generates a higher uplift per impact and therefore justifies the higher CPM.
But take a step back. Each of these estimates is now driven entirely by five little observations all clustered into one burst. This is a paucity of evidence. Are we going to claim, with a straight face, that January sales are up because we tweaked the settings on a £120k digital campaign? The evidence is too thin, and econometric models aren’t that powerful.
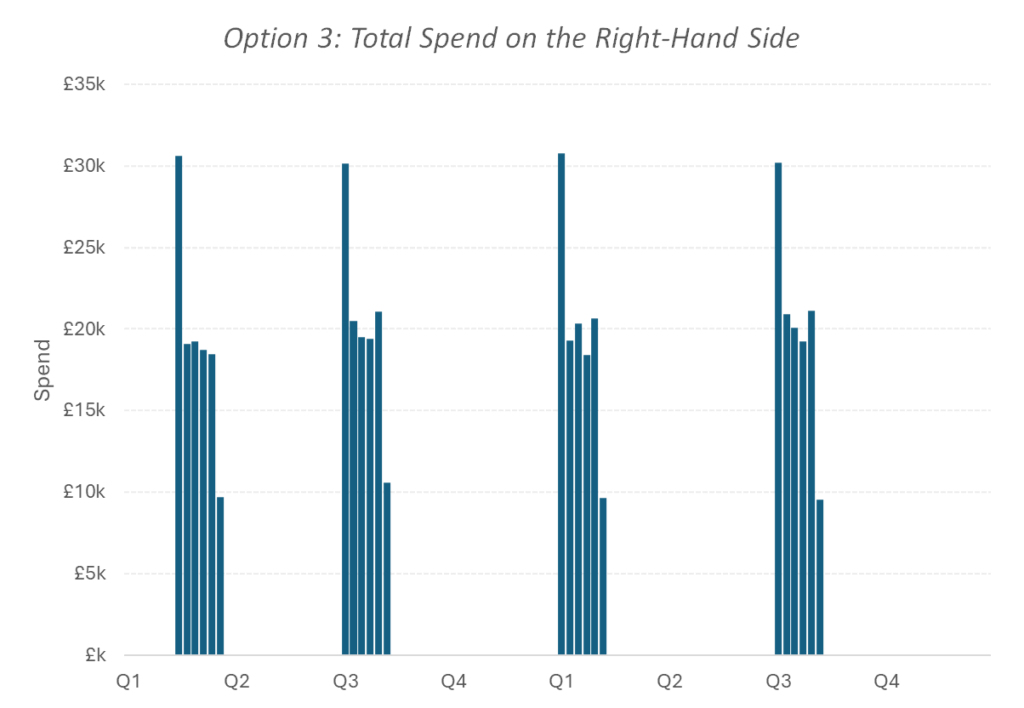
That gets us to Option 3. You group your activity together and just put spend on the right-hand side. Your coefficient can now be interpreted as uplift per £100k. We don’t automatically penalise premium inventory and your initial estimate is robust – drawing on evidence from multiple bursts over the last few years.
But what if you crave more granular insights? What if the whole point of econometric modelling is to inform within channel tactics? Fine, in that case might want to consider splitting things out in an exploratory little secondary model with some fancy maths.
Potential solutions from Meta and Alphabet
Meta and Alphabet are full of smart folk who are aware of the problem, but they also want granularity of reporting across their product suite, so they are making best efforts to ameliorate the issue.
Meta has an open-source package called Robyn that uses Elastic Net regression. It is a useful approach to measurement but, depending on your settings, tends to put a very light thumb on the scale in favour of the long tail of media lines.
Google has Meridian, which is powered by Bayesian maths. This also offers a partial solution to overfitting. But these solutions tend to stabilise the model, rather than fundamentally solve the identification problem.
At Ebiquity, our platform incorporates OLS, Bayesian and Elastic Net and we also do deep-dive studies for clients who yearn for more granularity. But let’s get back to the main topic…. using media spend as an independent variable on the right-hand side.
Summing up
So, what is the point I’m trying to make here in this – admittedly – very niche debate?
Keeping your main model a little simpler and just putting spend on the right-hand side, instead of using impressions and being forced to split everything up to the nth degree, is starting to look like the more defensible position. The taboo has broken, you can put spend on the right-hand side of your equation. We won’t judge you. There may be many flavours of impressions, but as they say … a dollar is a dollar is a dollar.