

At our recent ERA26 conference, I posed a question to a room full of marketing and media professionals: hands up if you are currently faced with conflicting metrics and data points, and are wondering which ones to use when guiding decision making.
Nearly every hand went up.
The industry is drowning in data, and the consequences are significant.
The paradox we face
The uncomfortable truth is marketers today have access to 230% more data than they did just five years ago. Many are juggling 50 or more metrics for a single campaign. Yet despite this explosion of information, two-thirds of marketing leaders cannot prove the overall impact of their investments.*
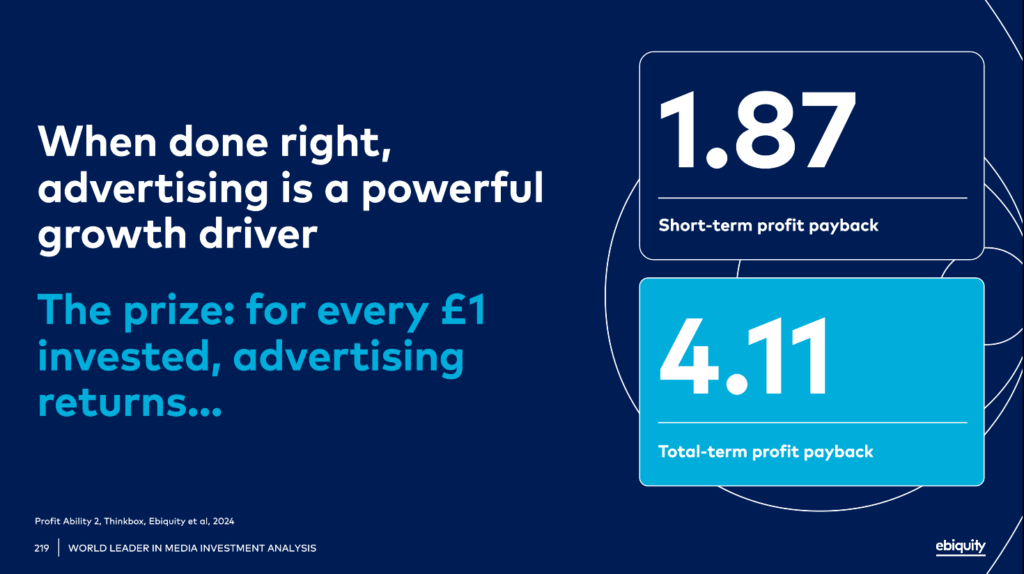
But here is the opportunity. When done well, advertising is a phenomenal growth engine. Research we helped co-author last year, Profit Ability 2, demonstrated that for every pound invested in advertising, the average return is £1.87 in short-term profit. Across the total term, that number stretches to £4.11. Advertising, when executed correctly, should be treated as an investment, not a cost.
That opportunity exists for every advertiser. The challenge is proving it works, investment by investment, by measuring what actually matters.
Diagnosing the measurement challenge
Three interconnected problems are creating this crisis of confidence.
First, the data and metric explosion. The proliferation of channels and platforms has brought different measurement universes and data points. The reality? The majority of those 50+ metrics are vanity metrics. They are not predictors of business outcomes.
Second, measurement fragmentation. Marketing mix modelling, incrementality testing, digital attribution, brand equity analysis. Many of these are done in isolation. Siloed organisations create siloed analytics, producing incomplete pictures with conflicting views. The result is analysis paralysis.
Third, the efficiency trap. When tasked to demonstrate value, it is human nature to chase lower CPMs and better rates. But a relentless drive towards efficiency without considering effectiveness is a race to the bottom. The great irony is that an obsessive focus on efficiency can be the single reason that drives efficiency itself down.
Building a framework that fixes it
Any meaningful measurement framework starts with data architecture. You cannot build a house on unstable foundations. This means identifying potential data sources, centralising disparate data sets under one umbrella (sales, platform data, media data, brand data, measurement outputs), and establishing proper data governance and quality control.
From there, we can get into meaningful measurement. The starting point is the ROI equation.
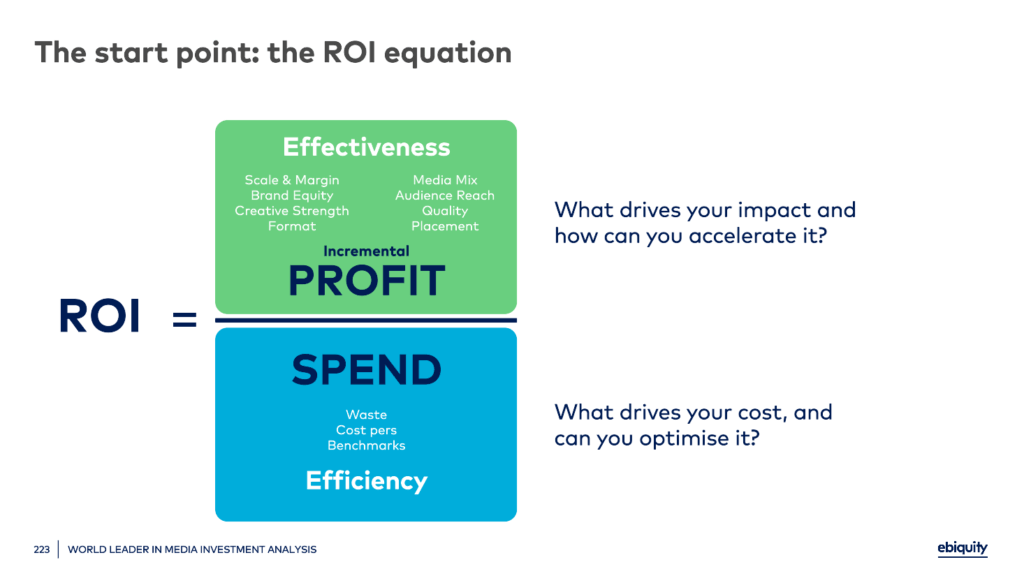
ROI is a balancing act between effectiveness and efficiency. The art is getting that balance right and understanding what drives both sides of the equation. ROI is a blunt instrument, a point on a curve. But as a data point, it provides the gateway to future optimisation opportunities.
What we are really looking to establish is the effectiveness-efficiency relationship across channels. Plot your channels on a two-by-two matrix with cost per unit on the x-axis and uplift per unit on the y-axis. From there, you can categorise performance.
The winners sit top left: high uplift, low cost. Explore how to scale these. The losers sit bottom right: high cost, low uplift. These are prime candidates to deprioritise. But the other two quadrants are where it gets interesting.
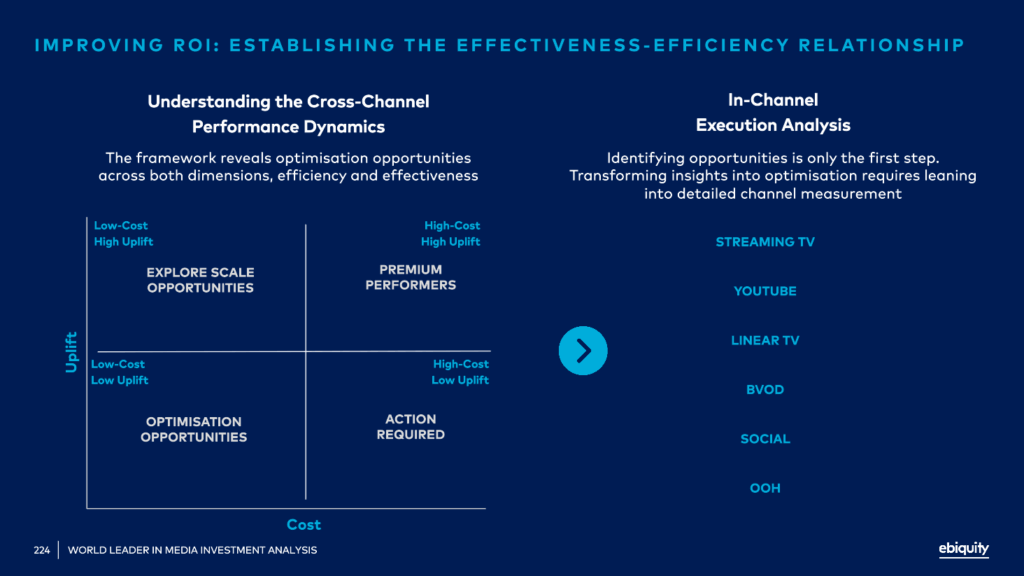
Take a channel that sits bottom left: low cost, low uplift. This could be a really good candidate to scale, but you need to understand what happens to inventory quality as you increase investment. Conversely, a channel sitting top right shows good uplift but at higher cost. You want to understand what is driving that cost. Is it inventory quality, frequency, saturation, screen delivery mix? By interrogating those ingredients, you can potentially shift that channel’s position significantly.
This is why in-channel execution analysis is critical. You do not want to turn your back on a channel without giving it the opportunity to thrive.
Putting the K back into KPI
This brings us to the heart of the framework: identifying the metrics that matter.
The first step is isolating the role of media on the plan by controlling for pricing, promotions, competitors and creative effectiveness. Then you go deeper within channel to get to the indicators that predict success. This is about eliminating vanity metrics and getting to the lead indicators of outcome.
What emerges is genuinely interesting. You move from an overwhelming landscape of metrics to a handful of KPIs rooted in statistical rigour. These become your command and control mechanisms. You can track against targets and baselines, and when performance goes off pace, you know exactly where to look to rectify it.
Take those metrics that matter and roll them up into an aggregate, composite score that reflects the relative importance of each metric. This offers a standardised view across channels and helps drive strategic decision making.
It is not about throwing more data at you. It is about establishing the right connections rooted in business success.
Delivering strategic advantage
This framework delivers tangible benefits. Every decision, whether budget allocation, media mix selection, channel selection, timings or inventory quality, becomes linked to business growth. Better data leads to better measurement, better decisions, better results. This becomes a continuous improvement cycle that protects and potentially grows your budget.
And here is where it gets particularly interesting. When you can identify the media metrics that predict business results, you create the foundation for compensating agencies based on the business outcomes they deliver. This is a question many clients are asking as we move into a world where AI is transforming media processes and remuneration models.
The early movers will win. It is about getting focused on the metrics that matter for optimal decision making. The aim is fuelling business growth.
In a world drowning in data, clarity is the ultimate competitive advantage.