Welcome to the Wheelhouse, a series of blogs from Ebiquity’s Marketing Effectiveness team.
In this final edition of the Wheelhouse blog for 2023, Group Director Nic Pietersma weighs up the pros and cons of including brand ‘pay per click’ (PPC) advertising in econometric models of market mix modelling (MMM).
Spoiler alert: in this article, Nic sets out his position that the answer to the question in the title of this blog is “probably no”, detailing his arguments and rationale as to why not. And he runs a detailed simulation that makes the abstract concrete. Warning: may contain equations.
The primer
Before we get to the main argument, here’s a quick primer on the debate.
The terms it’s possible to buy using PPC can generally be split into either generics (‘car insurance’, ‘best mattress’) or any bidding which includes brand terms (‘Acme insurance’, ‘Acme mattress’). You also get Shopping PPC and Google’s P-Max, where instead of managing a keyword bid, you receive automatic budget allocation. In this article, however, we’re focused on Brand PPC; PPC that includes your trademark in the search term. Analysts disagree about whether Brand PPC should or should not be included in an MMM model.
The argument
So, why is this controversial? The more cautious camp argues that Brand PPC doesn’t cause sales, but rather happens because of sales. Or at least, it’s a result of website traffic, which is itself caused by something else. The problem with putting a navigational variable in an econometric model is that it is “endogenous”. Put simply, this means that the causality runs in the wrong direction. That way madness lies, biased estimates, dragons, and other things it’s best to avoid. One especially egregious result is that it can ‘steal credit’ from above-the-line media (ATL) and brand building investment. Quel horreur!
The counterargument
Firstly, it is not strictly true that Brand PPC has no causal “oomph” whatsoever. Generally, if a brand doesn’t appear in the search engine results page near the top, customers simply scroll down and click on an organic link. But since about 2008 – ancient history in the annals of PPC – Google has allowed competitor bidding, which means there is an opportunity for your competitors to hijack the customer journey and inject themselves into the consideration set as your customers scroll past. Based on experience with Ebiquity clients, we are confident that Brand PPC does have some incrementality; there’s more on that later.
Secondly, if it is true that Brand PPC both steals credit from ATL and is driven by ATL in turn, wouldn’t an even better approach be to quantify these effects and calculate them through to your final ROI? This way, we would recognise that Brand PPC has incremental value, but it wouldn’t steal credit from any of that sweet ATL investment. This ‘nested model’ approach is very widespread in MMM, it features in many client briefs, and it’s sometimes recommended by Google.
Right. Now we’re caught up with the argument and counterargument on both sides.
Let’s run a simulation
Our argument in this debate is that the common ‘solution’ of including Brand PPC as a predictor in your main MMM model – and then building a nested, Brand PPC model to reallocate a bit of credit back to ATL – is not a good solution. Yes, it addresses the problem of stealing credit from ATL. Nevertheless, your main sales model is still circular; you are still trying to explain your sales performance using a factor that is driven by your sales performance. This cannot be interpreted in any meaningful way.
We can test this assertion by analysing some simulated data. The idea here is that we generate a synthetic dataset based on known “true” relationships and some randomly generated external factors. Then we go on to build some econometric models to see if we can accurately extract the “true” coefficients or reverse engineer the synthetic dataset.
First, let’s start with the true sales equation:
Eq1: 𝑺𝒂𝒍𝒆𝒔=𝟏𝟎𝟎𝟎∗𝑴𝒂𝒓𝒌𝒆𝒕+𝟏∗𝑨𝑻𝑳 𝑹𝒂𝒕𝒊𝒏𝒈𝒔+𝟎.𝟐∗𝑩𝒓𝒂𝒏𝒅.𝑷𝑷𝑪.𝑻𝒓𝒂𝒄𝒌𝒆𝒅.𝑺𝒂𝒍𝒆𝒔+𝝈_sales
In words: our sales follow the market (a coefficient of 1000 to pick an arbitrary number), plus we get one sale for every ATL rating (GRP) we buy, plus 20% of the tracked sales we get from Brand PPC are truly caused by Brand PPC. This means that, if you switched off Brand PPC, those sales would go away. Additionally, there is some level of randomness (sigma or σ).
Next, we can define our true Brand PPC equation:
Eq2: Brand.PPC.Tracked.Sales=0.2∗Sales+0.5∗ATL Ratings+ σ_brand_ppc
Again, explained in words: Brand PPC tracks about 20% of your total sales. ATL also really does support Brand PPC performance (with a typical coefficient of 0.5), and some of this is truly incremental to sales (as shown in the first equation, above). This is the commonsense mental model many marketing folks adhere to, and it’s the reason why nested Brand PPC models keep getting added to MMM briefs.
Testing, testing
To simplify the story, we are assuming that Brand PPC spend just follows demand and we use tracked sales as a measure of Brand PPC rather than clicks, spend, or impressions. Arguably this is an over-simplification, but it keeps the maths neater.
For the simulation itself, we will generate ten datasets with four years of data each. Market and ATL investments are generated as random normal distributions, and ATL spend is assumed to be week-on/week-off. We will evaluate the synthetic data using various econometric approaches to see how accurately we can extract the true coefficients we used to generate the dataset in the first place. Let’s consider the impact of three tests.
1. Test Option 1: We put Brand PPC into the main sales model as an explanatory factor, then build a second model to reallocate credit back to ATL. This is the common nested model approach.
2. Test Option 2: We just accept that Brand PPC cannot be modelled, and we do not include it in our main sales model. This is the leave-it-out and keep-it-simple approach.
3. Test Option 3: We include Brand PPC in our main sales model, but with a strict Bayesian prior or a constraint set close to the true value. This is the nested option, but where we apply an external, non-econometric estimate of Brand PPC’s contribution.
As a reminder, we expect the true ATL coefficient to be about 1.1, which is 1.0 from direct impact on sales and 0.1 from the effect via Brand PPC. This, in turn, is based on a 0.5 coefficient to ATL ratings, multiplied by 0.2 coefficient of Brand PPC tracked sales to topline sales. The expected coefficients are shown as black lines on the charts below.
The outcome
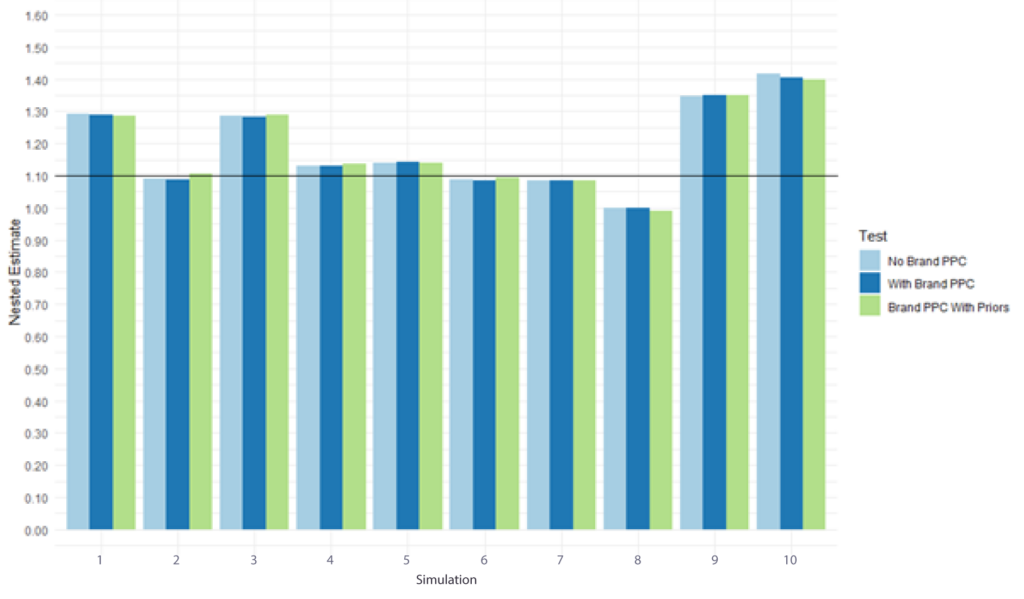
Let’s start with some good news. If you’re using nesting in all three models, you get to the same endpoint on the impact of ATL. If Brand PPC is left out of the main sales model, the ATL and the market driver coefficients inflate it a little bit, getting you right back to the same end point. This is shown in Figure 1.
What this simulation does illustrate however is that, giving ATL another bite at the cherry should not make much difference to the result, even if an eager analyst reports that they have discovered x% of ATL returns happens *through* or as a result of Brand PPC.
Figure 1. Comparison of Total Nested ATL Coefficient across three modelling approaches
So, no harm done? Actually, not really.
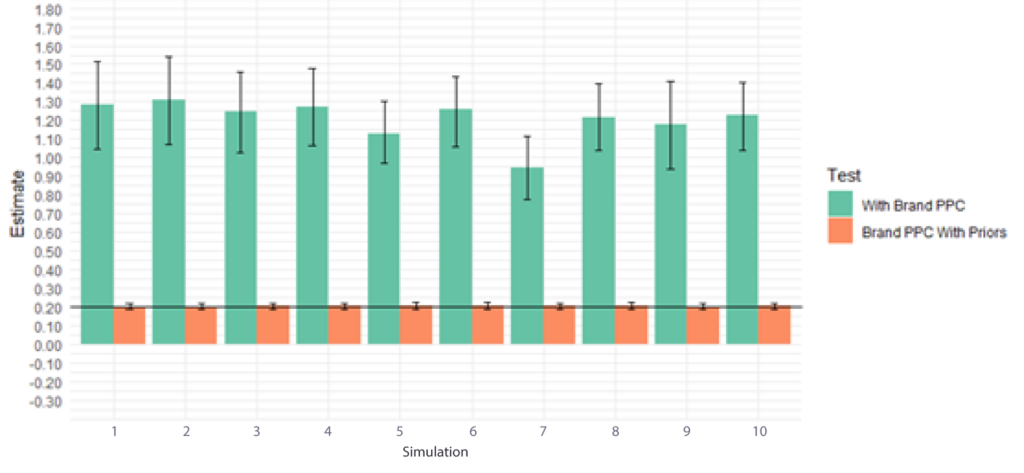
Let’s consider this in a bit more detail. In the sales model that included Brand PPC but no prior, Brand PPC has run amok and claimed way more than its true contribution (see Figure 2). It should be in the range of 0.2, but appears to have a coefficient closer to 1.2. Error bars show a 5% to 95% confidence interval which comes nowhere near the true value we used to generate the dataset. You cannot meaningfully interpret this number because of endogeneity – remember, that’s causality running in the wrong direction.
If – as would be laudable – the aim was to ‘control’ for Brand PPC’s incremental contribution, then we have to call this simulation out as a fail.
Figure 2. Comparison of Brand PPC Coefficient in ‘Main Sales Model’ across two modelling approaches
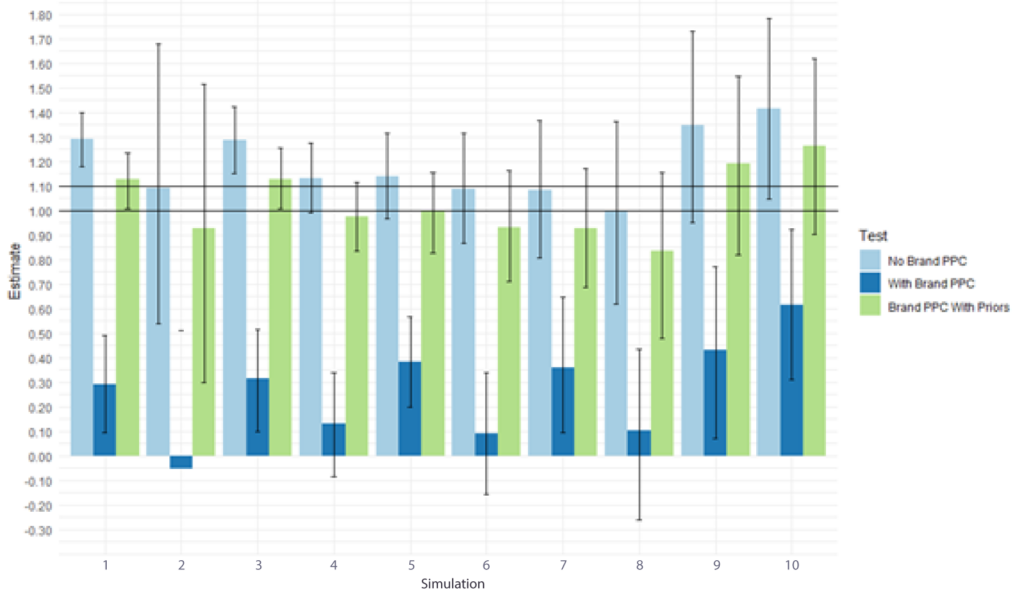
In Figure 3., the chart below shows the knock-on effect on ATL estimates in your main sales model which should be in the 1 to 1.1 range. The model with unconstrained Brand PPC has stolen credit from ATL. Yes, after nesting you do get back to the same point, but if you want to interpret your main econometric model in its own right, it’s an absolute disaster. In some simulations, the 5%-95% confidence interval falls below zero. We should not do this to our main sales model, which is supposed to be the main pillar of the MMM project and the most robust model on which to base investment decisions.
Figure 3. Comparison of Total ATL Coefficient in ‘Main Sales Model’ across three modelling approaches
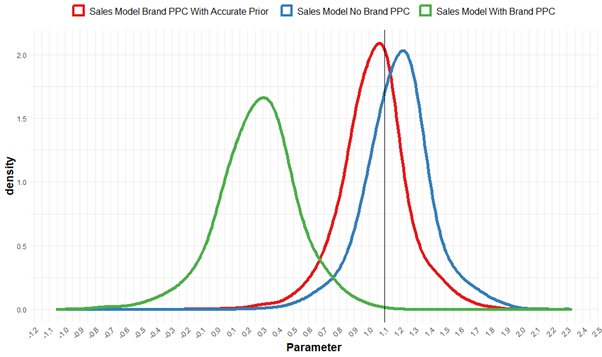
Looking at the posteriors in Figure 4., below, we can see that the impact of including unconstrained Brand PPC is not only to introduce a downward bias on ATL that downplays its true impact. This approach also increases the uncertainty of the ATL estimate. In other words, the endogenous Brand PPC variable is a precision vampire on your other coefficients, reducing their accuracy..
Iin practice, your analysts will be forced to spend more of their time grappling with an unstable model that they do not trust.
Figure 4. Simulated ATL Coefficient Estimates vs True Coefficient
And the winner is …
The approach that comes out looking best is Test Option 3: include Brand PPC in the main econometric model, but keep it on a tight leash. You need to set a prior or a hard constraint based on some estimate of true incrementality – and to be clear this is not based on any form of tracking, click-throughs, or multiple regression.
Obviously, all these numbers depend on the specific assumptions used to generate the synthetic dataset and can be criticised. Introduce some more noise in the Brand PPC data, or add some big bursts or dark periods, and then the bias doesn’t look so bad. If you increase the sample size that helps too. But the gist of this argument should be valid, even if the size of the effects varies.
Summing up: our recommendation
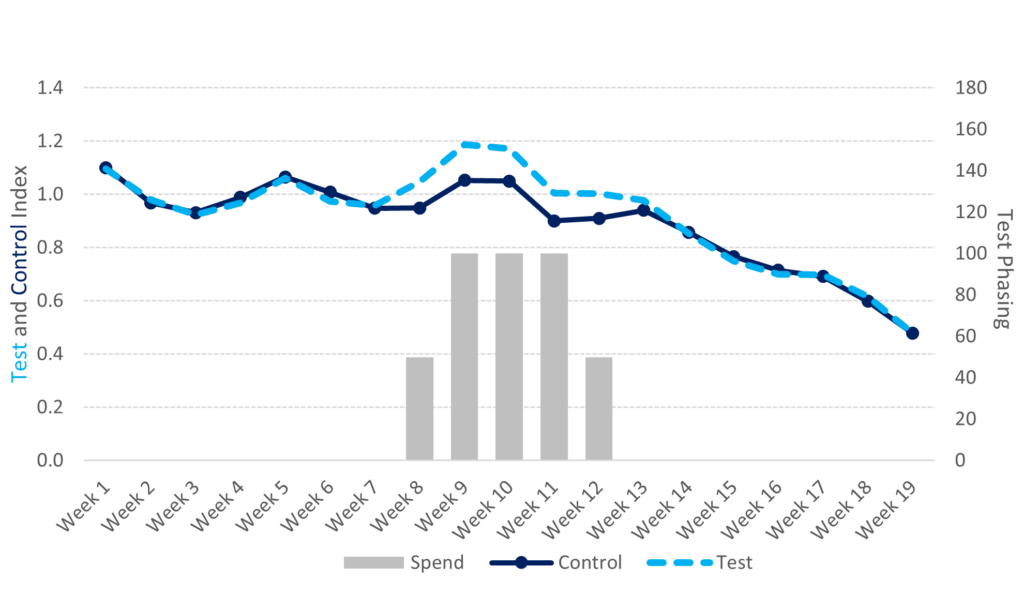
If you have a good approach for measuring the incremental value of Brand PPC, then you should feel free to add it to your main model, with a prior or a fixed coefficient, and proceed with caution. At Ebiquity, we do a lot of geotesting – boosting PPC in one or more geographical location(s) while running control cells with no investment – as this is a safe way of getting a read on Brand PPC’s true contribution. How this works and how it contributes is shown in Figure 5., below.
Using this approach, we have seen incrementality in the 10%-to-20% range versus tracking, but the impact may vary, as it depends on a competitive environment. You can also approach the problem of incrementality by looking at keyword transference to organic clicks as a proxy.
Figure 5. Geotesting: a safe way to measure Brand PPC
If you don’t have a valid way to measure incrementality, the keep-it-simple option of just leaving Brand PPC out the main model is probably the lesser evil. Let’s be honest, we all know it’s mostly just a cost of doing business.